Inspector
A standalone web dashboard for debugging agent sessions. Every action the model takes — every tool call, every iteration, every token spent — is captured automatically and presented in a single UI. Run your agent, then open the inspector to see exactly what happened and why.
ra --inspector                          # launch on default port 3002
ra --inspector --inspector-port 8080    # custom port
The inspector is a standalone interface — it reads saved session data from disk. Run your agent normally (CLI, REPL, HTTP, etc.), then launch the inspector separately to review sessions.
Open http://localhost:3002 in your browser.
Overview dashboard
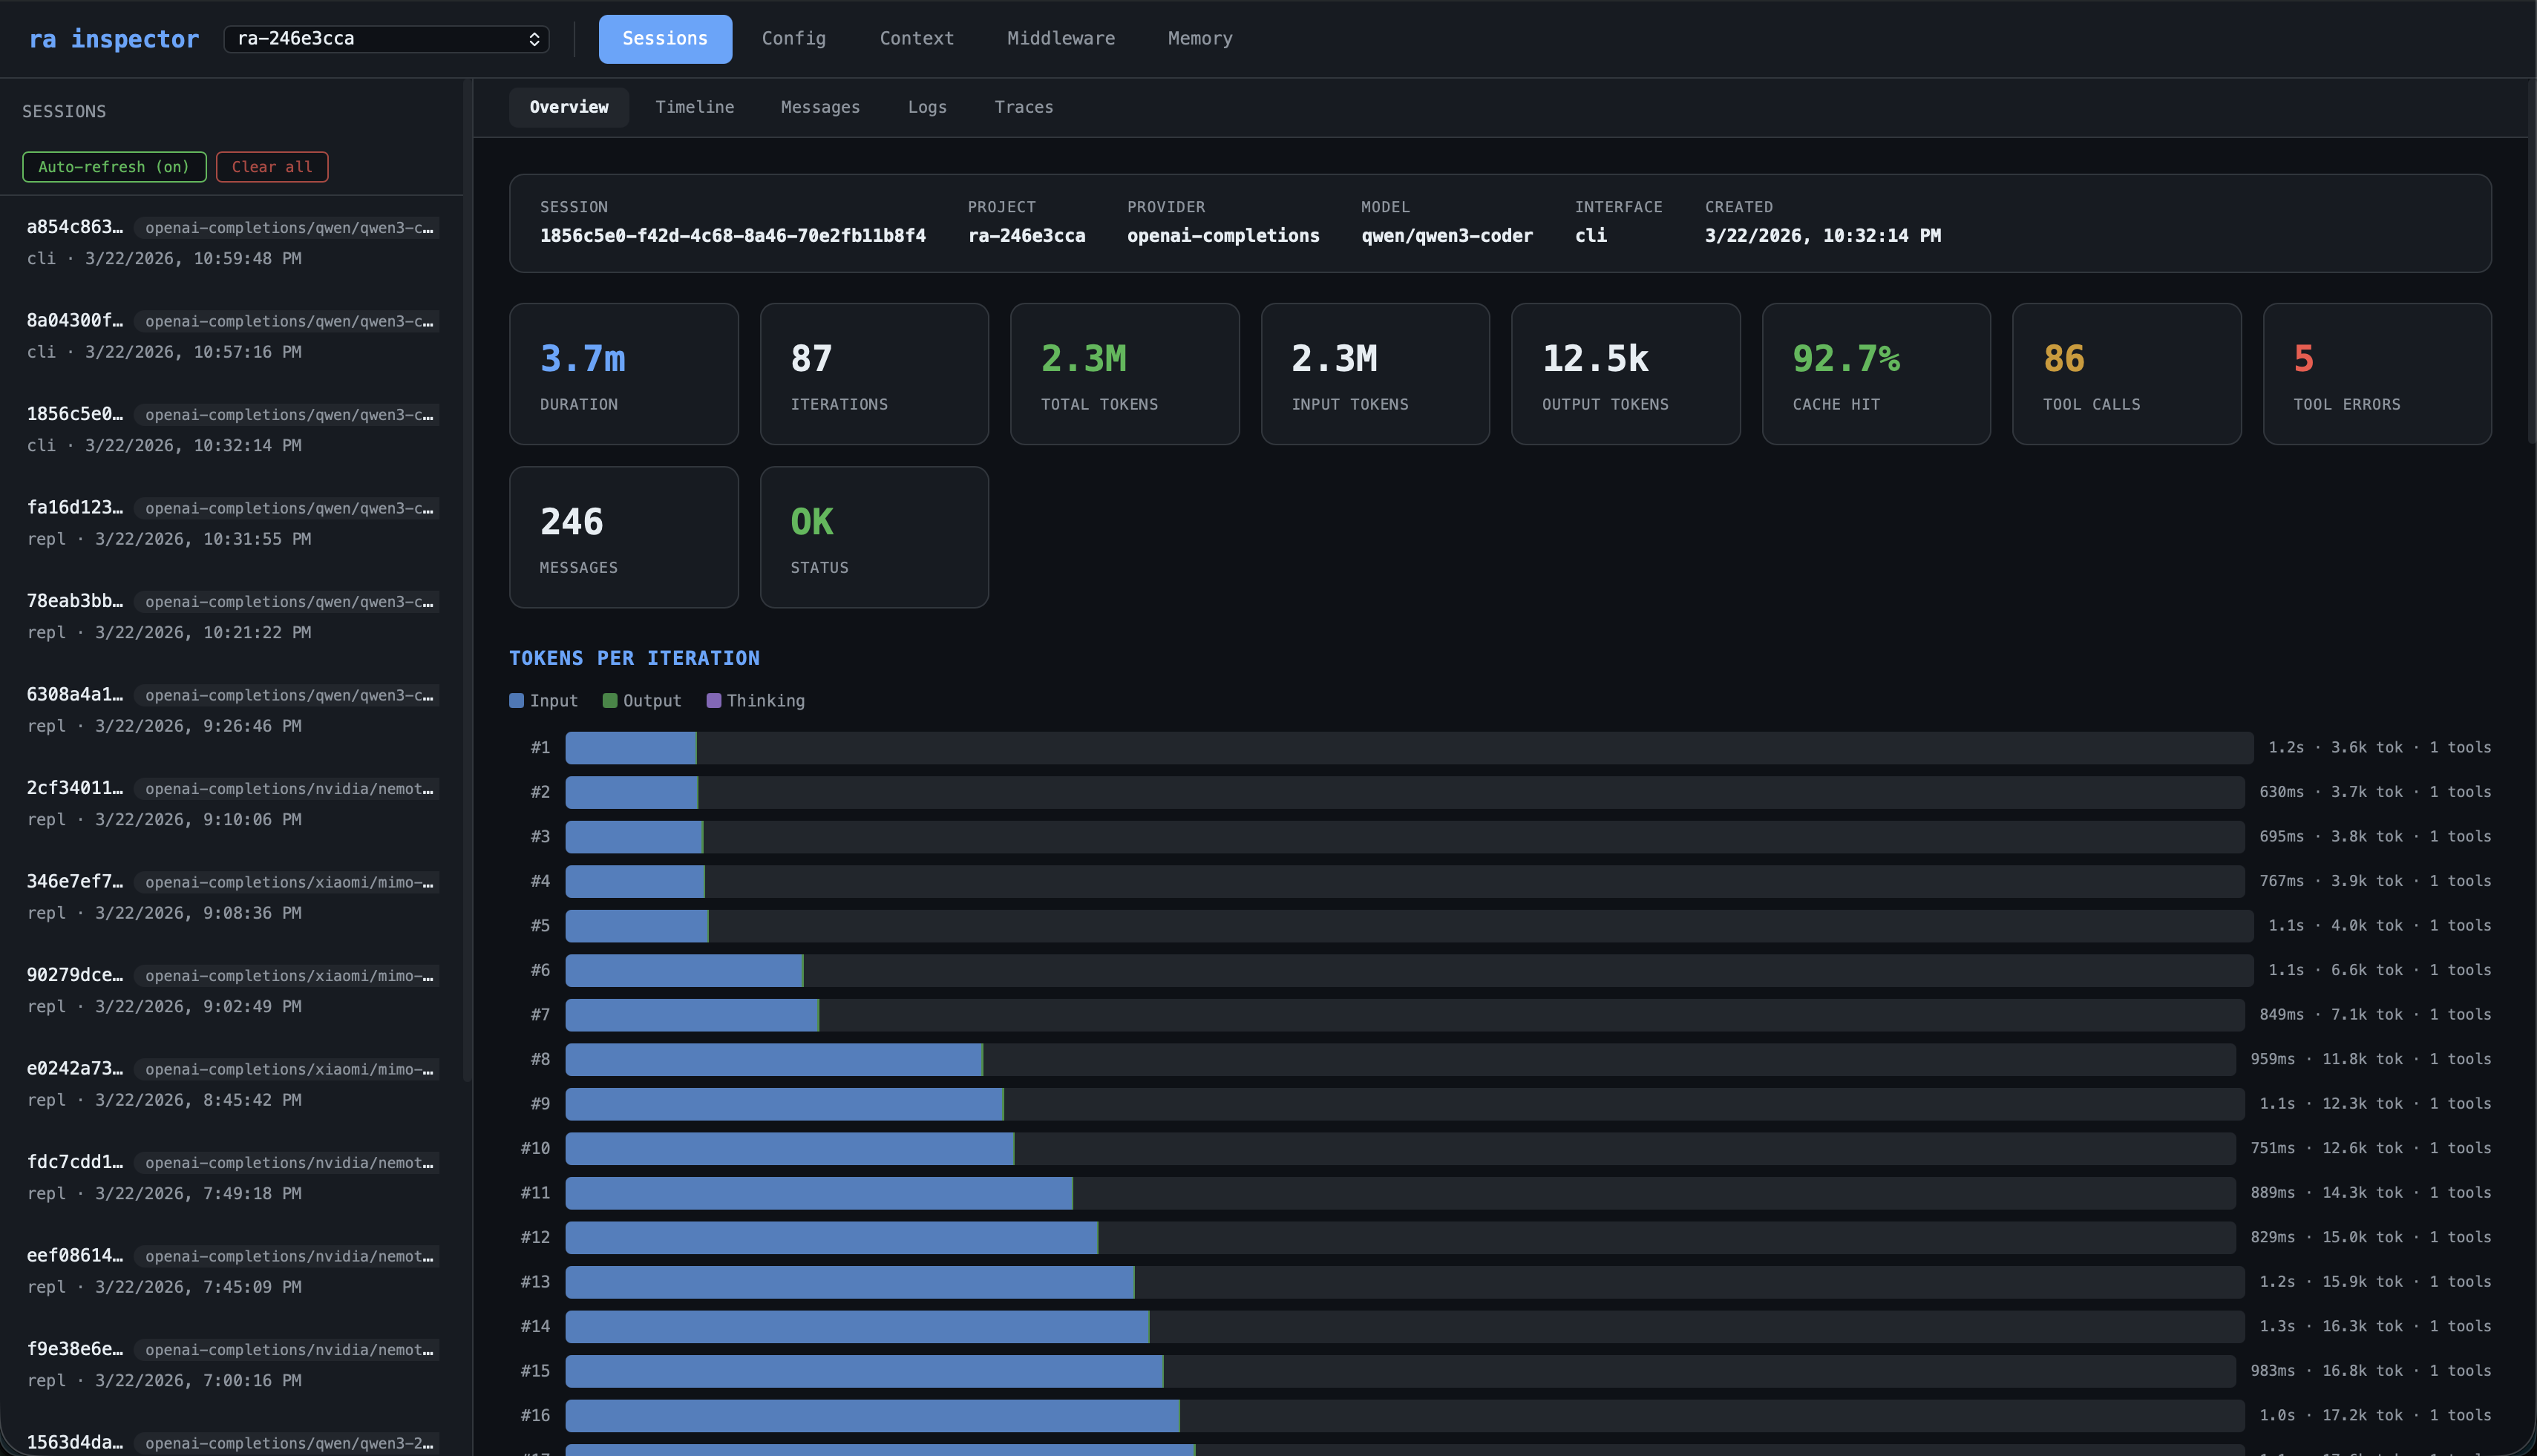
The Overview tab gives you the full picture of any session at a glance. At the top, a session header shows the provider, model, interface, and timestamp. Below that, stats cards surface the key numbers:
- Duration — total wall-clock time for the session
- Iterations — how many loop iterations the agent completed
- Total tokens — cumulative input + output across all model calls
- Input / Output tokens — broken out separately so you can see the ratio
- Cache hit % — what fraction of input tokens came from the prompt cache (higher = cheaper)
- Tool calls / Tool errors — how many tools were invoked and how many failed
- Messages — total message count in the conversation
- Status — final loop status (OK or error)
The Tokens per Iteration chart is a horizontal bar for every iteration, showing input (blue), output (green), and thinking (purple) tokens. Each bar is annotated with duration, total tokens, and tool count. You can see exactly where the model was thinking hardest, where cache hits kicked in (bars shrink as prefix caching warms up), and which iterations triggered tool calls.
The Tool Usage table lists every tool used in the session, sorted by call count, with columns for errors, total execution time, and average execution time. Spot slow tools, frequent failures, or unexpected usage patterns at a glance.
Session views
Select a session from the sidebar to see its data across five tabs:
| Tab | What it shows |
|---|---|
| Overview | Stats dashboard — duration, iterations, token totals, cache hit %, tool call/error counts, per-iteration token chart, tool usage table |
| Timeline | Chronological event stream — every model call (with token delta and cache %), every tool execution (with inputs/outputs), warnings and errors |
| Messages | Full message history — user, assistant, system, and tool messages with collapsible thinking blocks. See exactly what the model saw and said at each turn |
| Logs | Structured log entries — timestamp, level, message, and metadata fields from every subsystem |
| Traces | Hierarchical span tree — agent.loop → agent.iteration → agent.model_call / agent.tool_execution with duration, status, and attributes |
Global views
| Tab | What it shows |
|---|---|
| Config | Resolved configuration (API keys redacted) — see exactly what settings the agent ran with |
| Context | Discovered context files and glob patterns — verify what the model was given as context |
| Middleware | Active middleware hooks and registered functions |
| Memory | Browse, search, add, and delete persistent memories |
Timeline
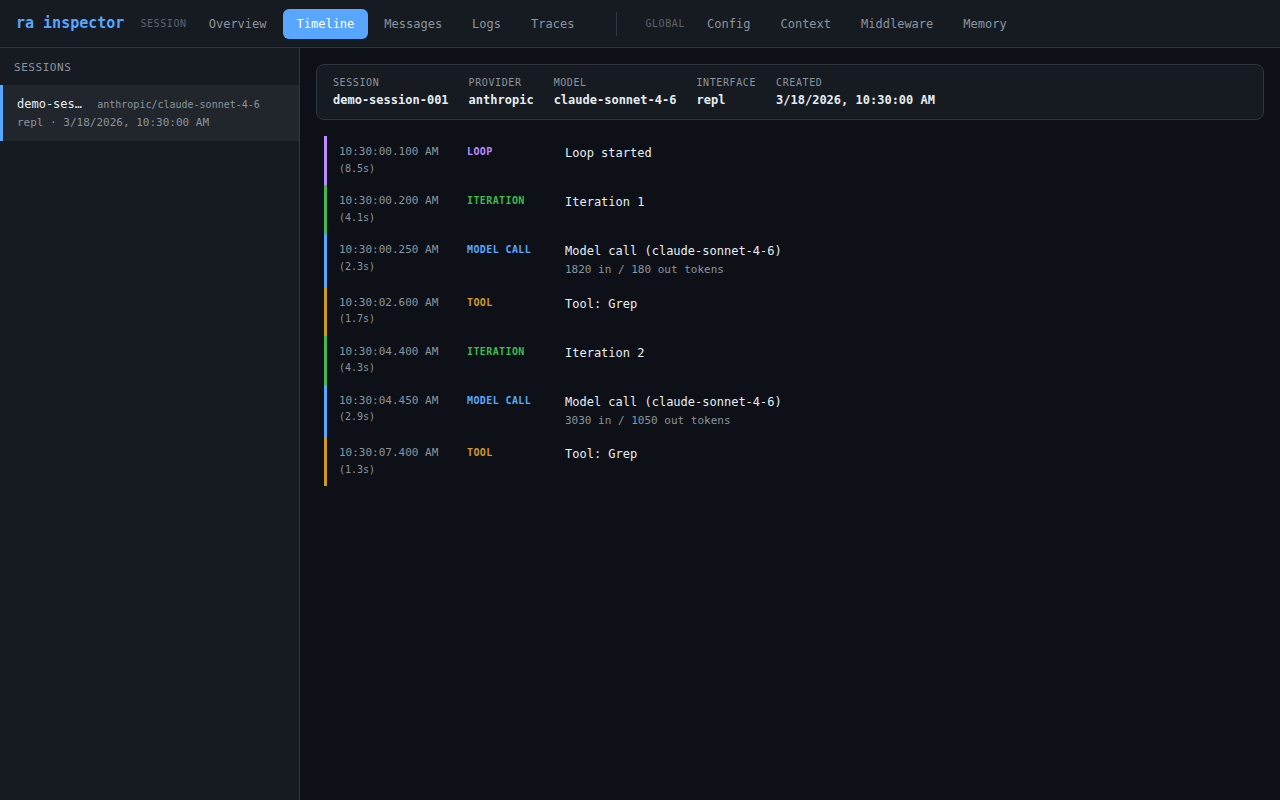
The Timeline tab merges two data sources into one chronological view:
- Trace spans —
agent.loop,agent.iteration,agent.model_call,agent.tool_execution - Log entries — only
warnanderrorlevel entries (to keep the timeline focused)
Each event shows its timestamp, duration, and type. Events are color-coded:
- Blue — model calls
- Orange — tool executions
- Green — iterations
- Purple — loop start/end
- Red — errors
Configuration
app:
  inspector:
port: 3002| Field | Env var | CLI flag | Default | Description |
|---|---|---|---|---|
inspector.port | RA_INSPECTOR_PORT | --inspector-port | 3002 | Port for the inspector server |
The inspector is enabled with the --inspector flag. It launches as its own interface — it cannot run as a sidecar alongside another interface (CLI, REPL, HTTP, MCP). Instead, run your agent sessions first, then launch the inspector separately to review them.
API endpoints
The inspector serves a JSON API that the dashboard consumes. You can also query it directly:
| Endpoint | Description |
|---|---|
GET /api/sessions | List all sessions (sorted newest first) |
GET /api/sessions/:id/stats | Aggregated stats from traces |
GET /api/sessions/:id/timeline | Chronological event stream |
GET /api/sessions/:id/messages | Raw message history |
GET /api/sessions/:id/logs | Structured log entries |
GET /api/sessions/:id/traces | Raw trace spans |
GET /api/config | Resolved config (keys redacted) |
GET /api/context | Discovered context files |
GET /api/middleware | Active middleware hooks |
GET /api/memory | List or search memories |
POST /api/memory | Create a memory |
DELETE /api/memory/:id | Delete a memory |
Example
# Run an agent session first
ra "Explain the architecture of this project"

# Then launch the inspector to review it
ra --inspector

# In another terminal, query the API directly
curl http://localhost:3002/api/sessions | jq '.[0].id'
curl http://localhost:3002/api/sessions/SESSION_ID/stats | jq '.totalTokens'
See also
- Observability — traces and logs that feed the inspector
- Sessions — session persistence and storage
- Configuration — full config reference